National Oil and Gas Gateway - Design & Markup (HTML/CSS)
This site was designed and developed from November 2016 to March 2017 for the U.S. Energy Information Administration (EIA), an agency of the U.S. Department of Energy.
This site was designed and developed from November 2016 to March 2017 for the U.S. Energy Information Administration (EIA), an agency of the U.S. Department of Energy.
The site was developed with the assistance of 2 developers to handle back-end data responsibilities. I was responsive for the design, layout, logo and branding, and developing the HTML and CSS for the entire site.
The site is live and can be viewed here: www.noggateway.org
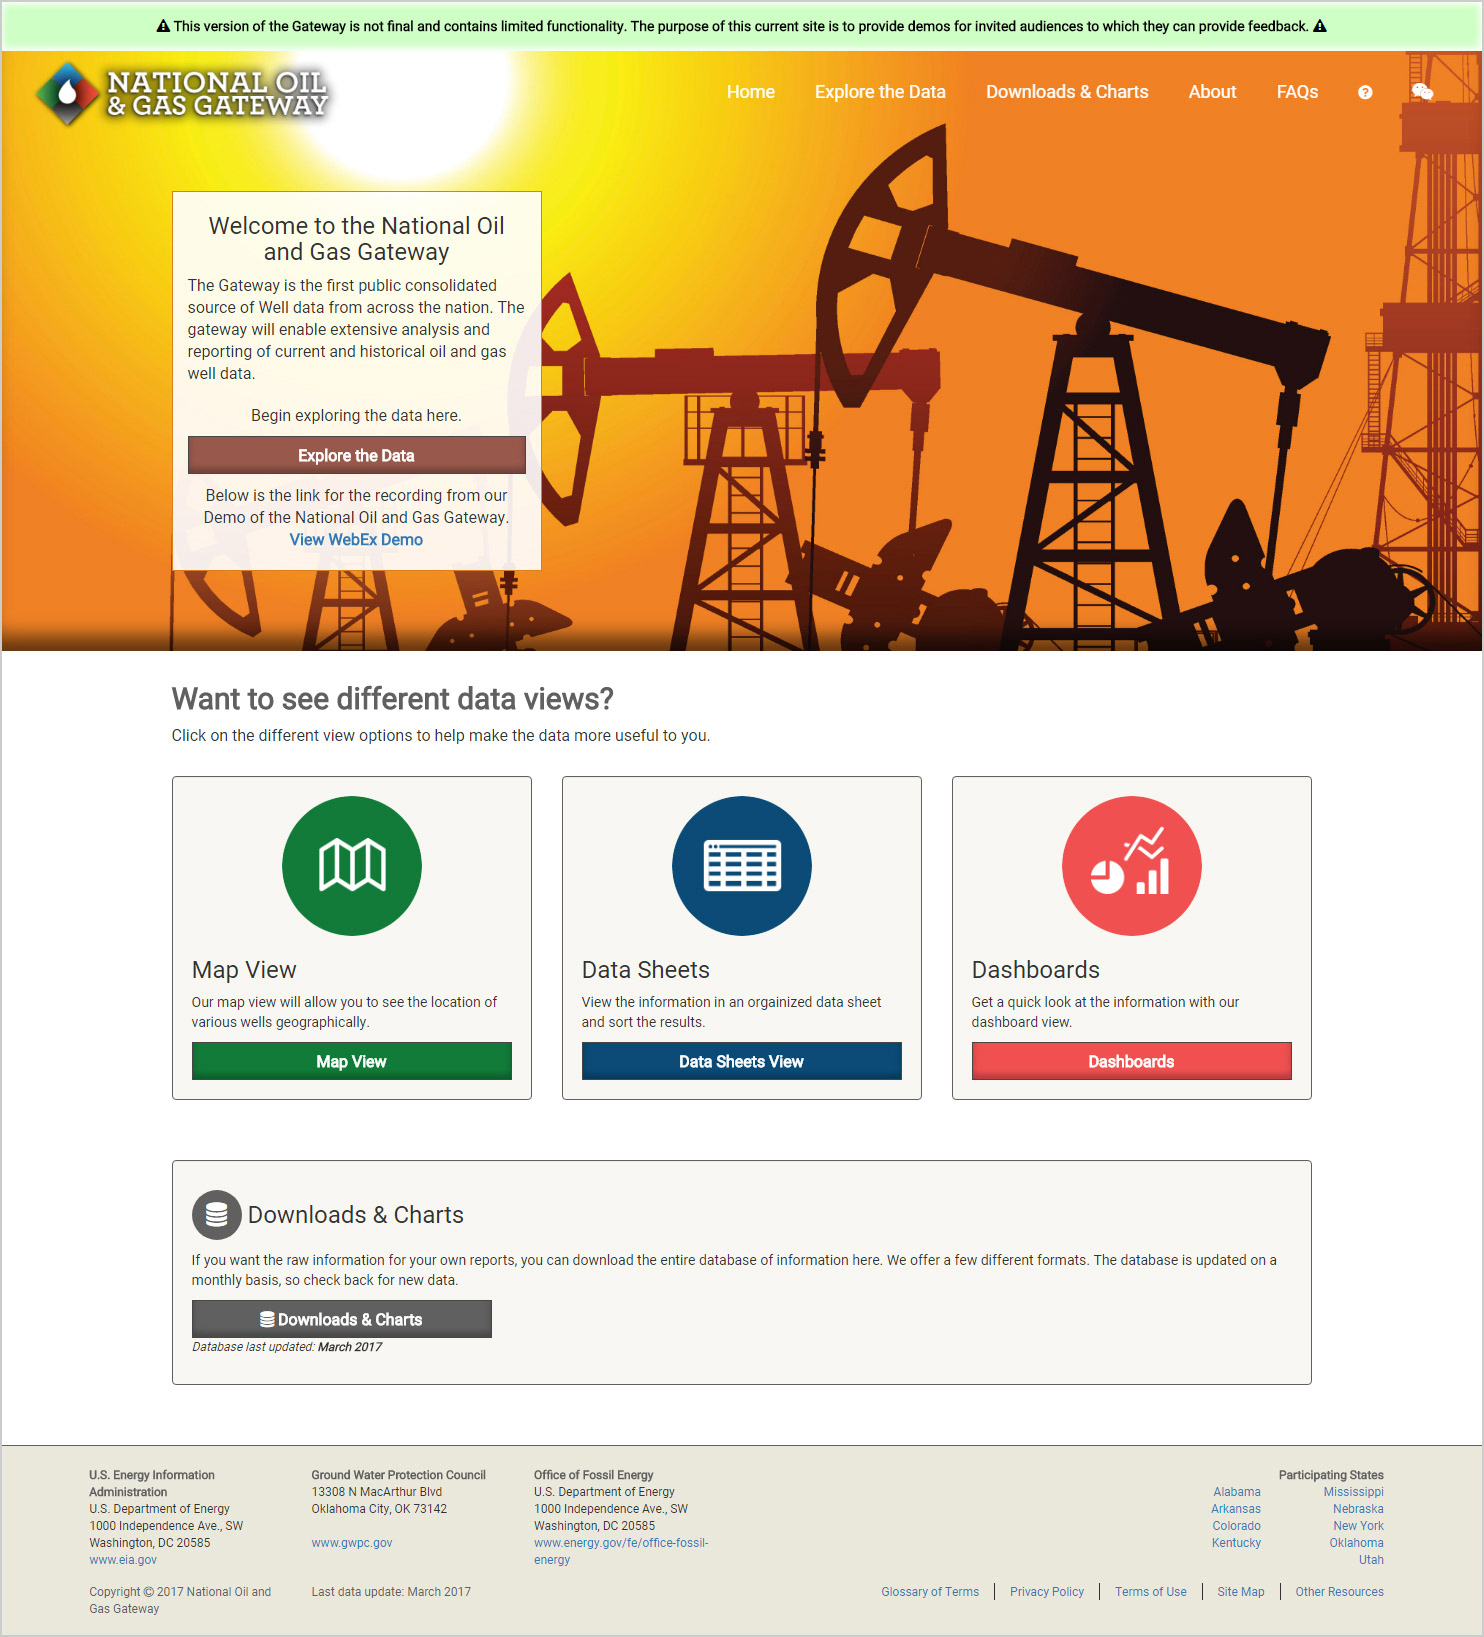
Home Page. From here, users can navigate to the "Explore" page to view the data as a Map, Data Sheet, or Dashboard view. There's also access to "static" or historical data in the Downloads & Charts section.
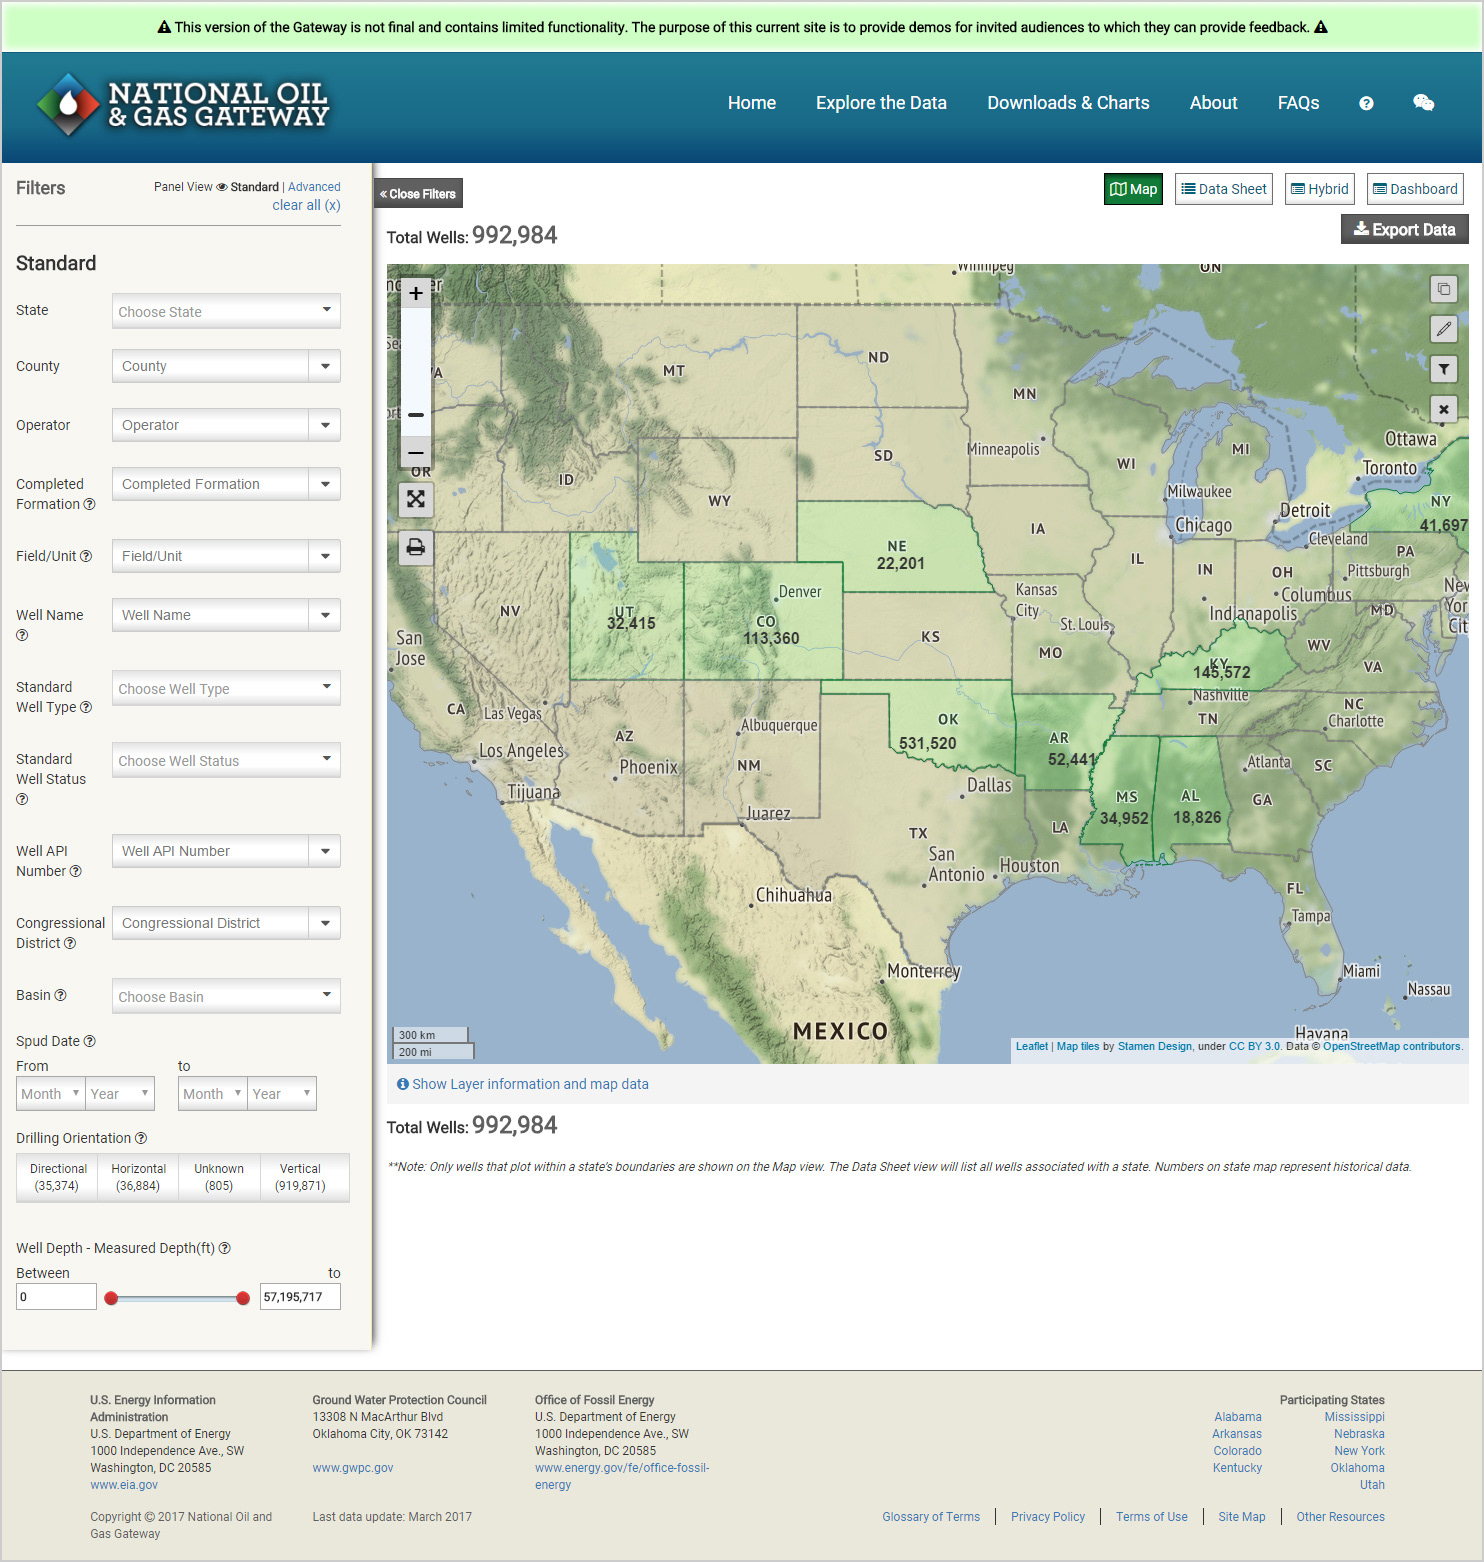
Data is fully available from this view. As data becomes filtered, the map will update to reflect a view that is easier to consume while providing valuable take away information. The Standard Filters on the left feature the most common filters as dictated by the client to allow quick and easy filtering.
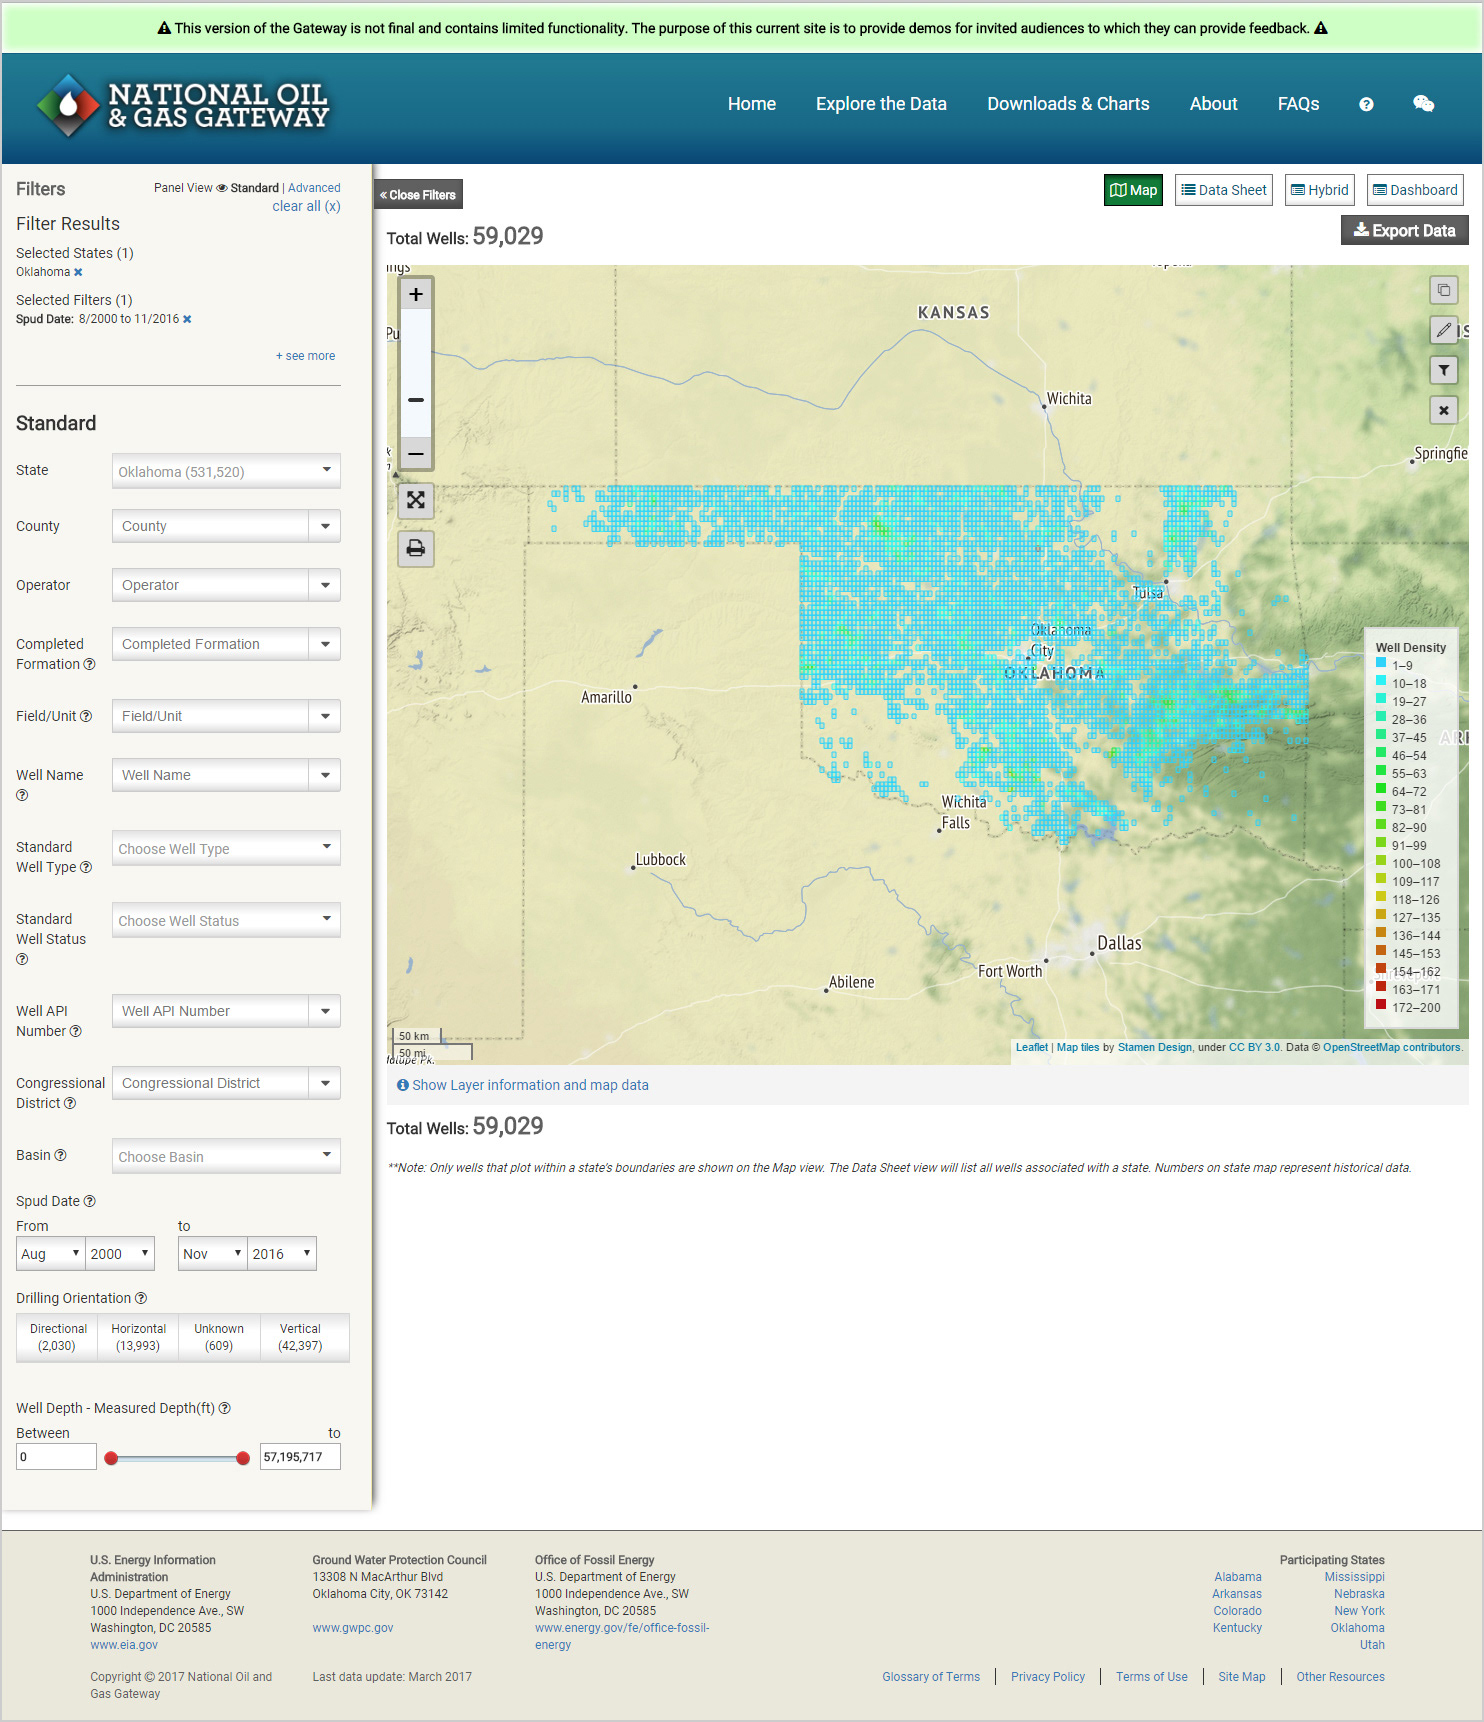
Upon filtering, the map adjusts itself down to the section (in this case the state of Oklahoma). The view updates to a 'heat map' approach to show the concentration of wells in an area. The individual sections can be clicked on to zoom the view down to highlight the selected component. The top left of the filters updates to show what has been filtered. Filtered items can be removed from here as well. The top left also shows what the current well count is based on current filtering.
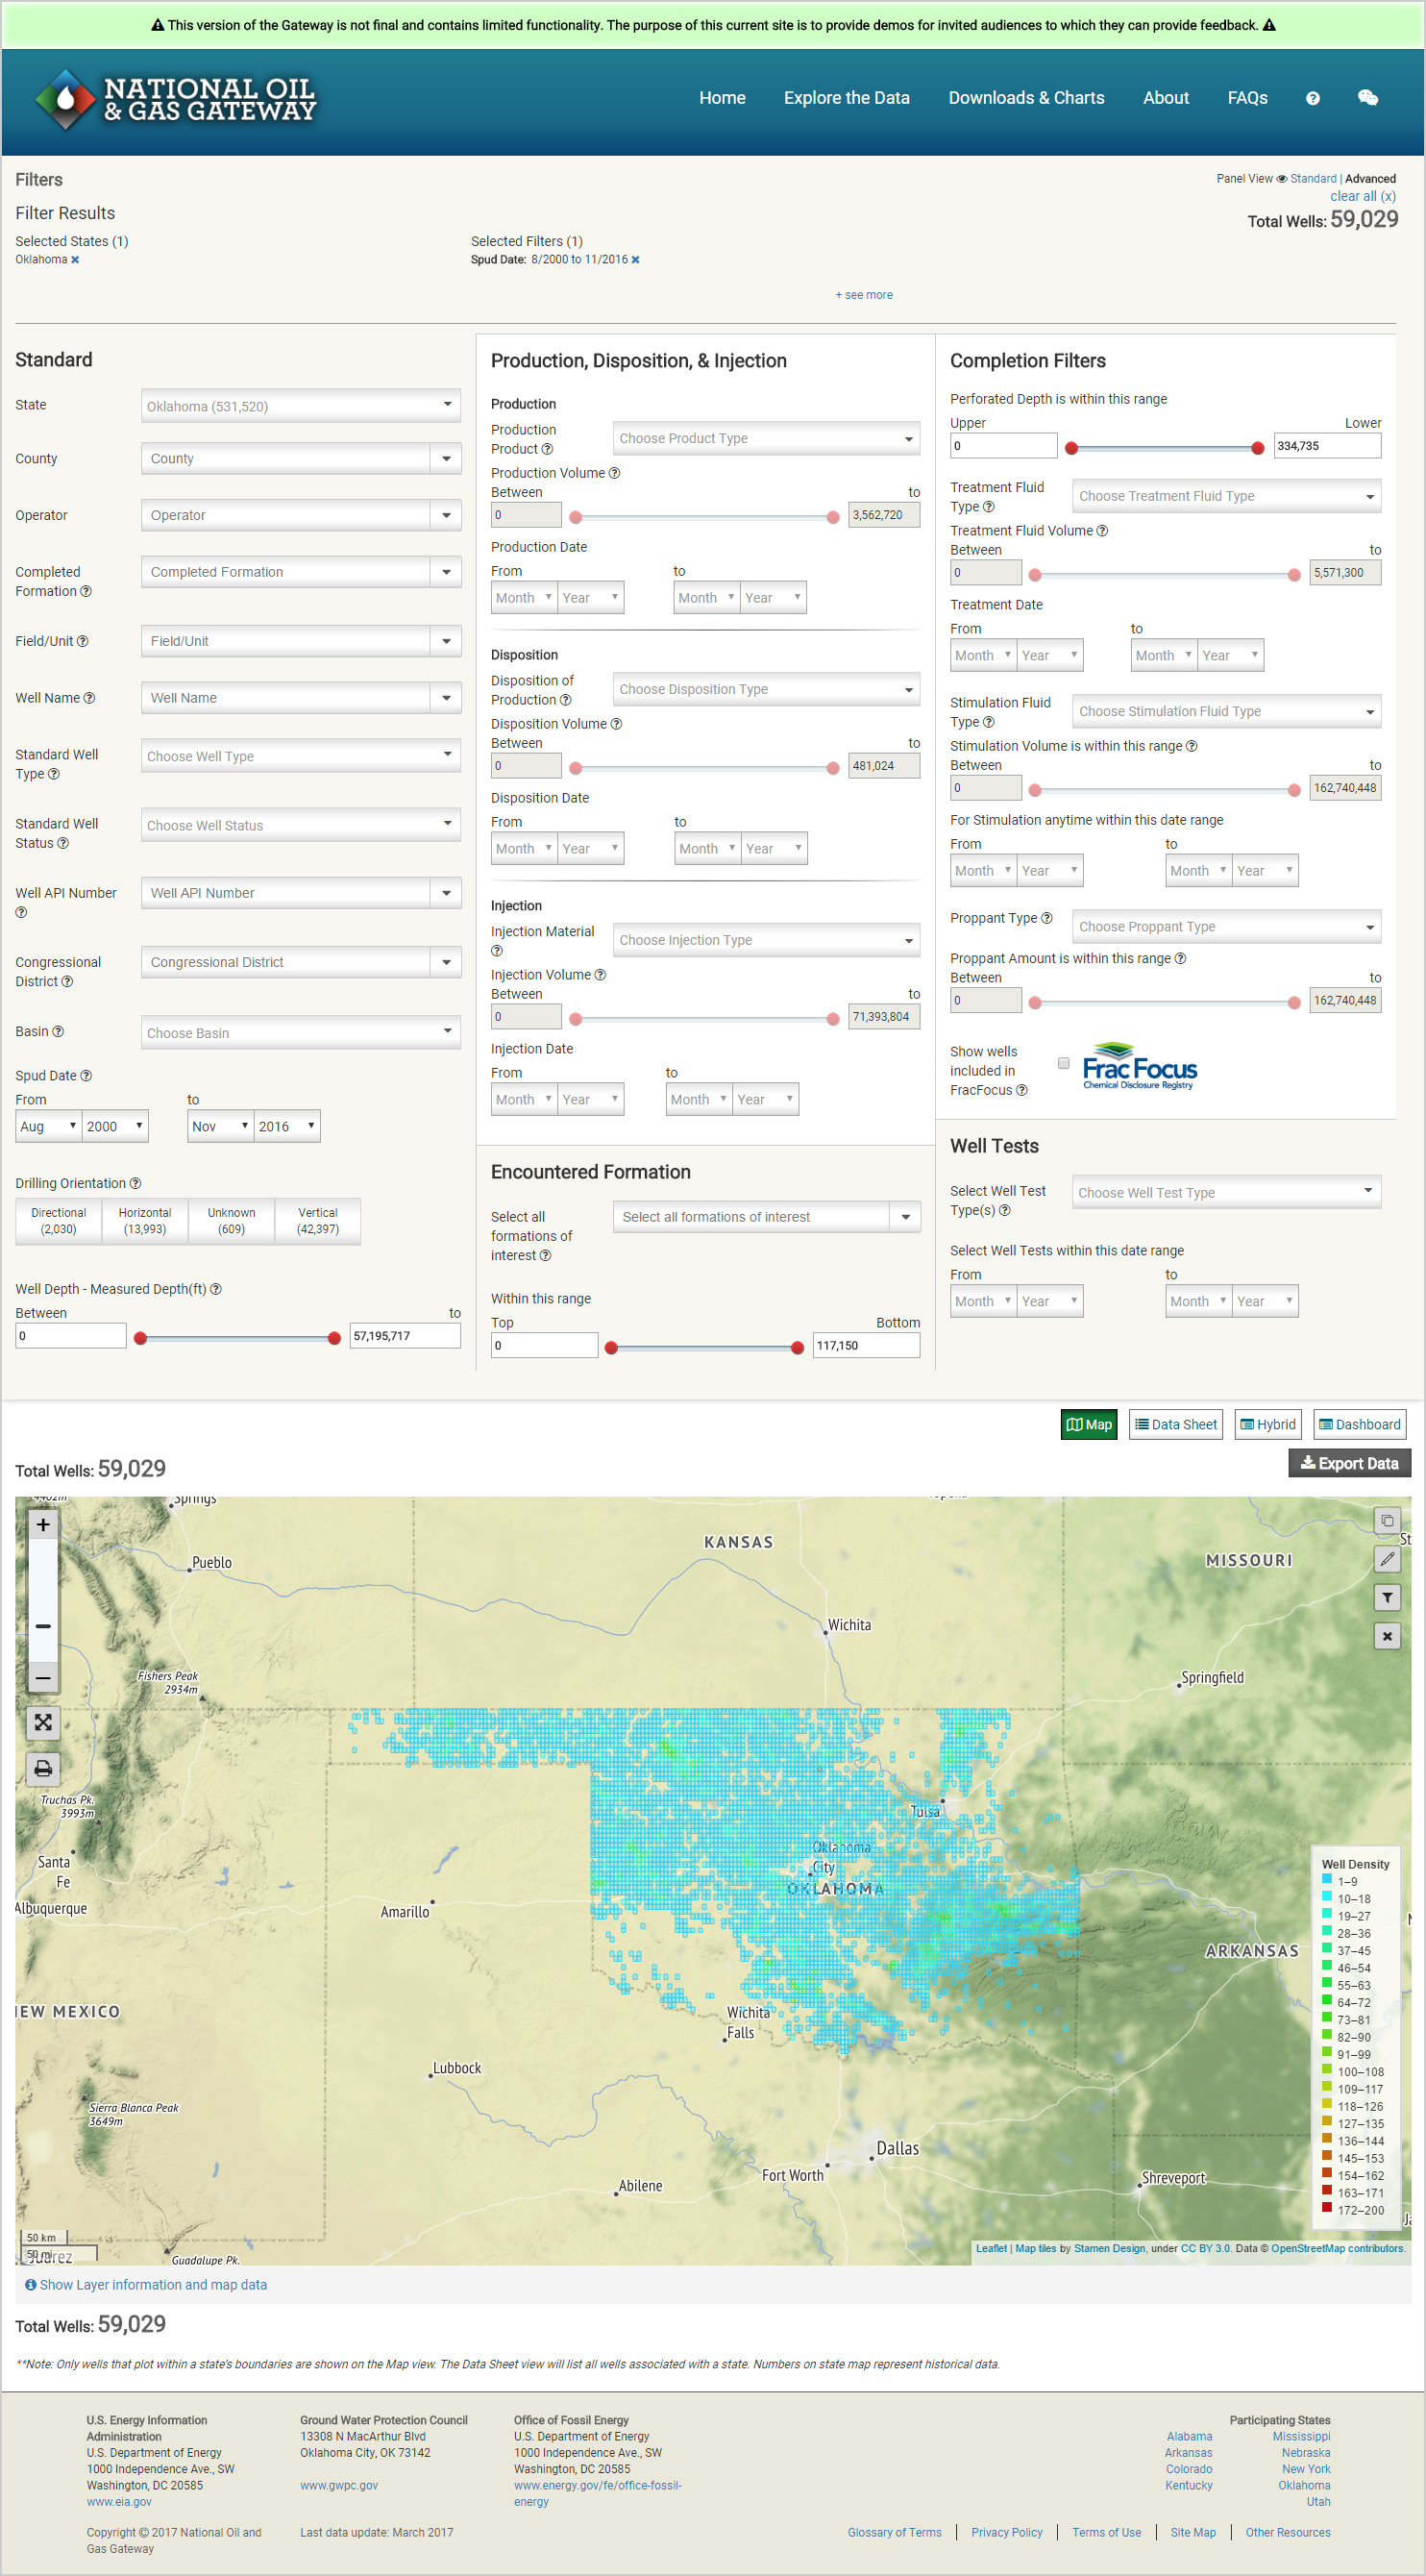
The Standard Filters cover 14 of the most common items the data reflects. Pressing the option for Advanced Filters expands the layout across while pushing the current Explore view below. Advanced Filters features 37 total filters (including the Standard set as well). This allows advanced users to further manipulate the data to a very fine detail.
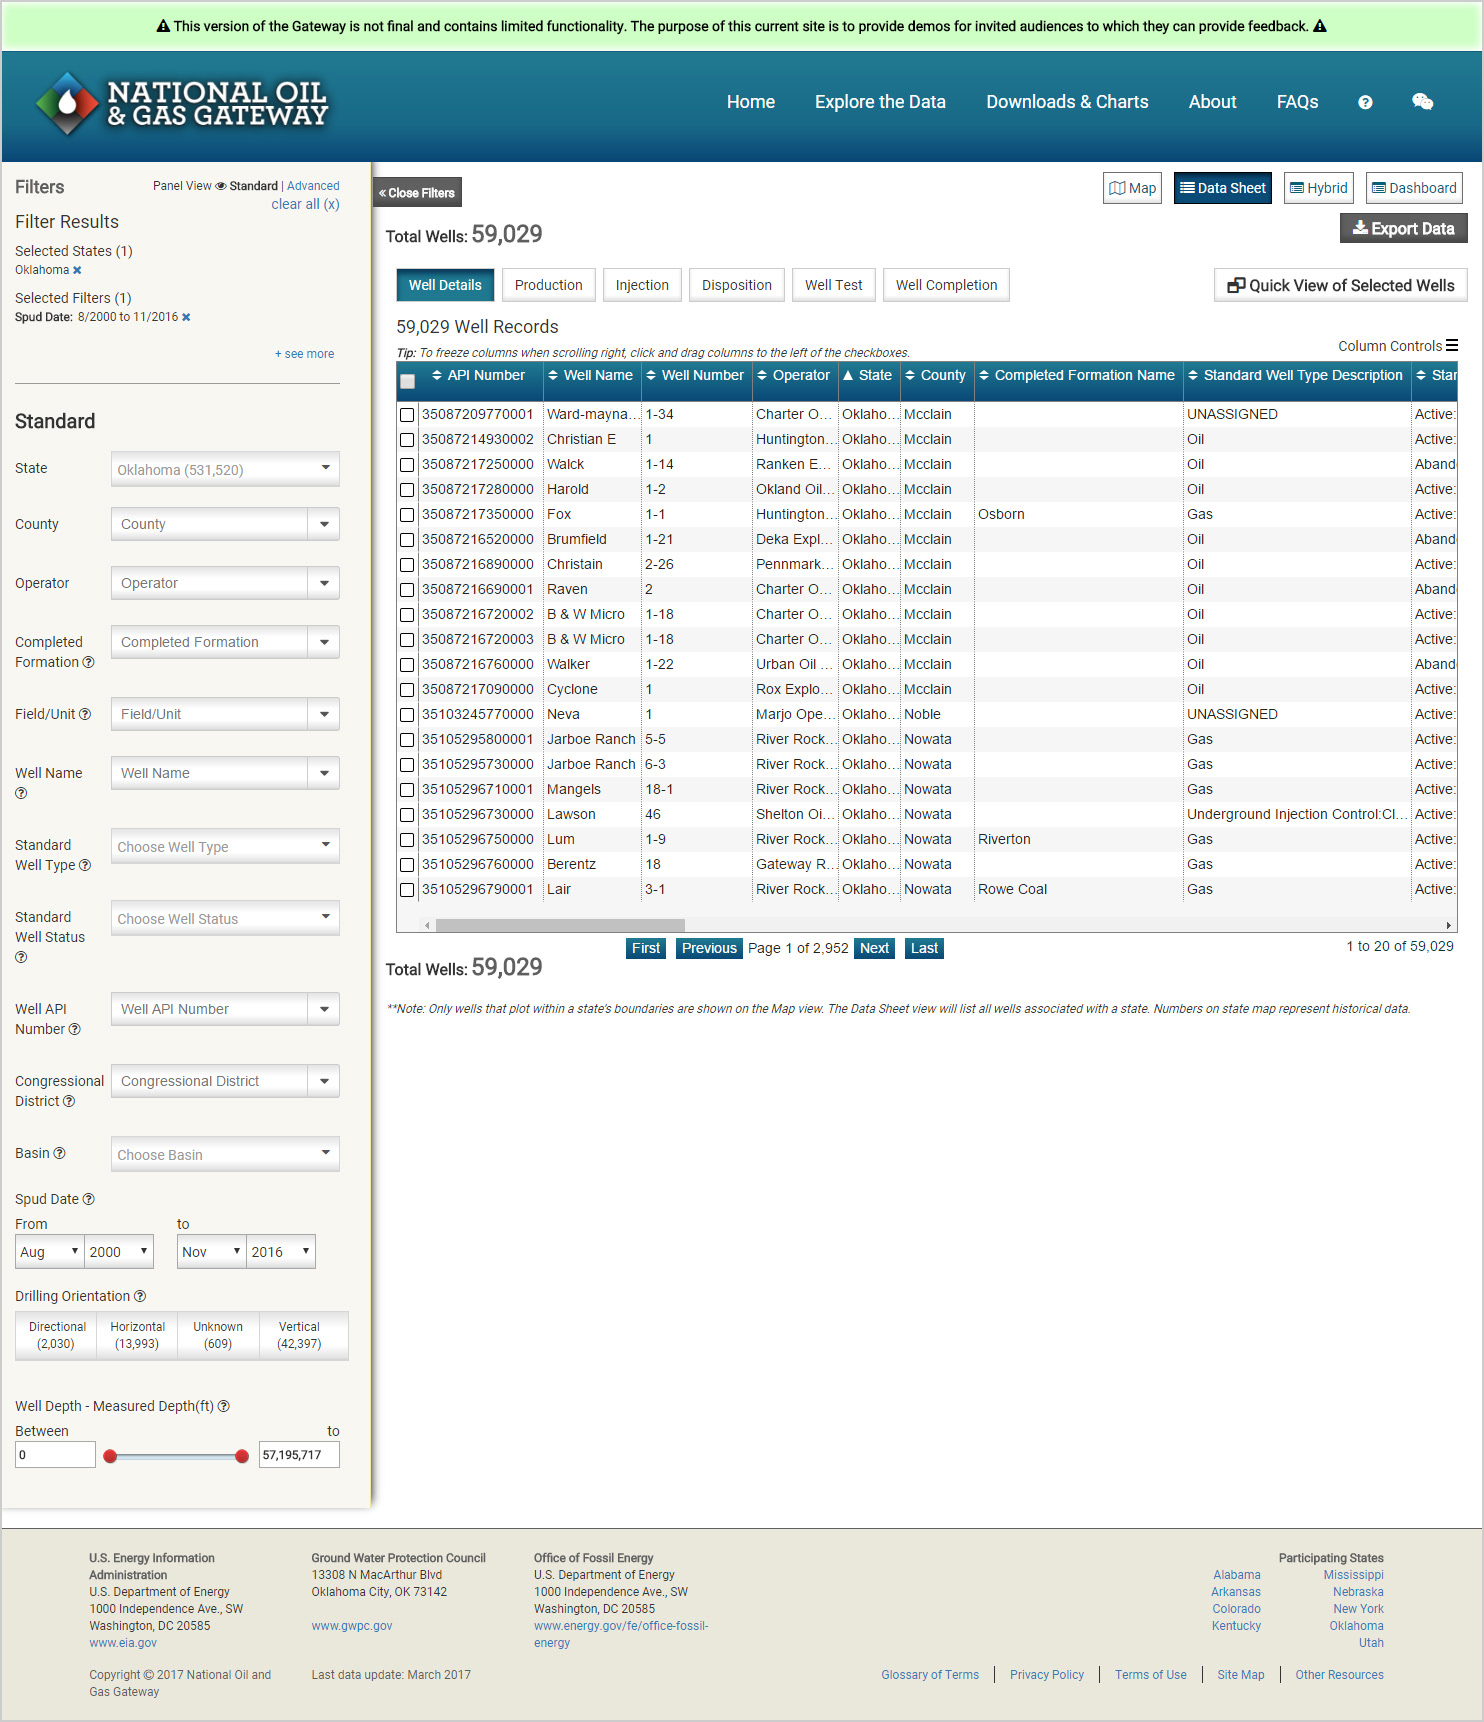
The Data Sheet view provides a simple data table layout of the information currently filtered. This allows for a detailed approach with hard numbers for analytical minded users. The well count maintains between the views. Directly below the well count, a set of views can be applied to the data to see it based on General Well Details, Production Values, Injection Data, Disposition of Product, Well Testing Data, and the Well Completion information.
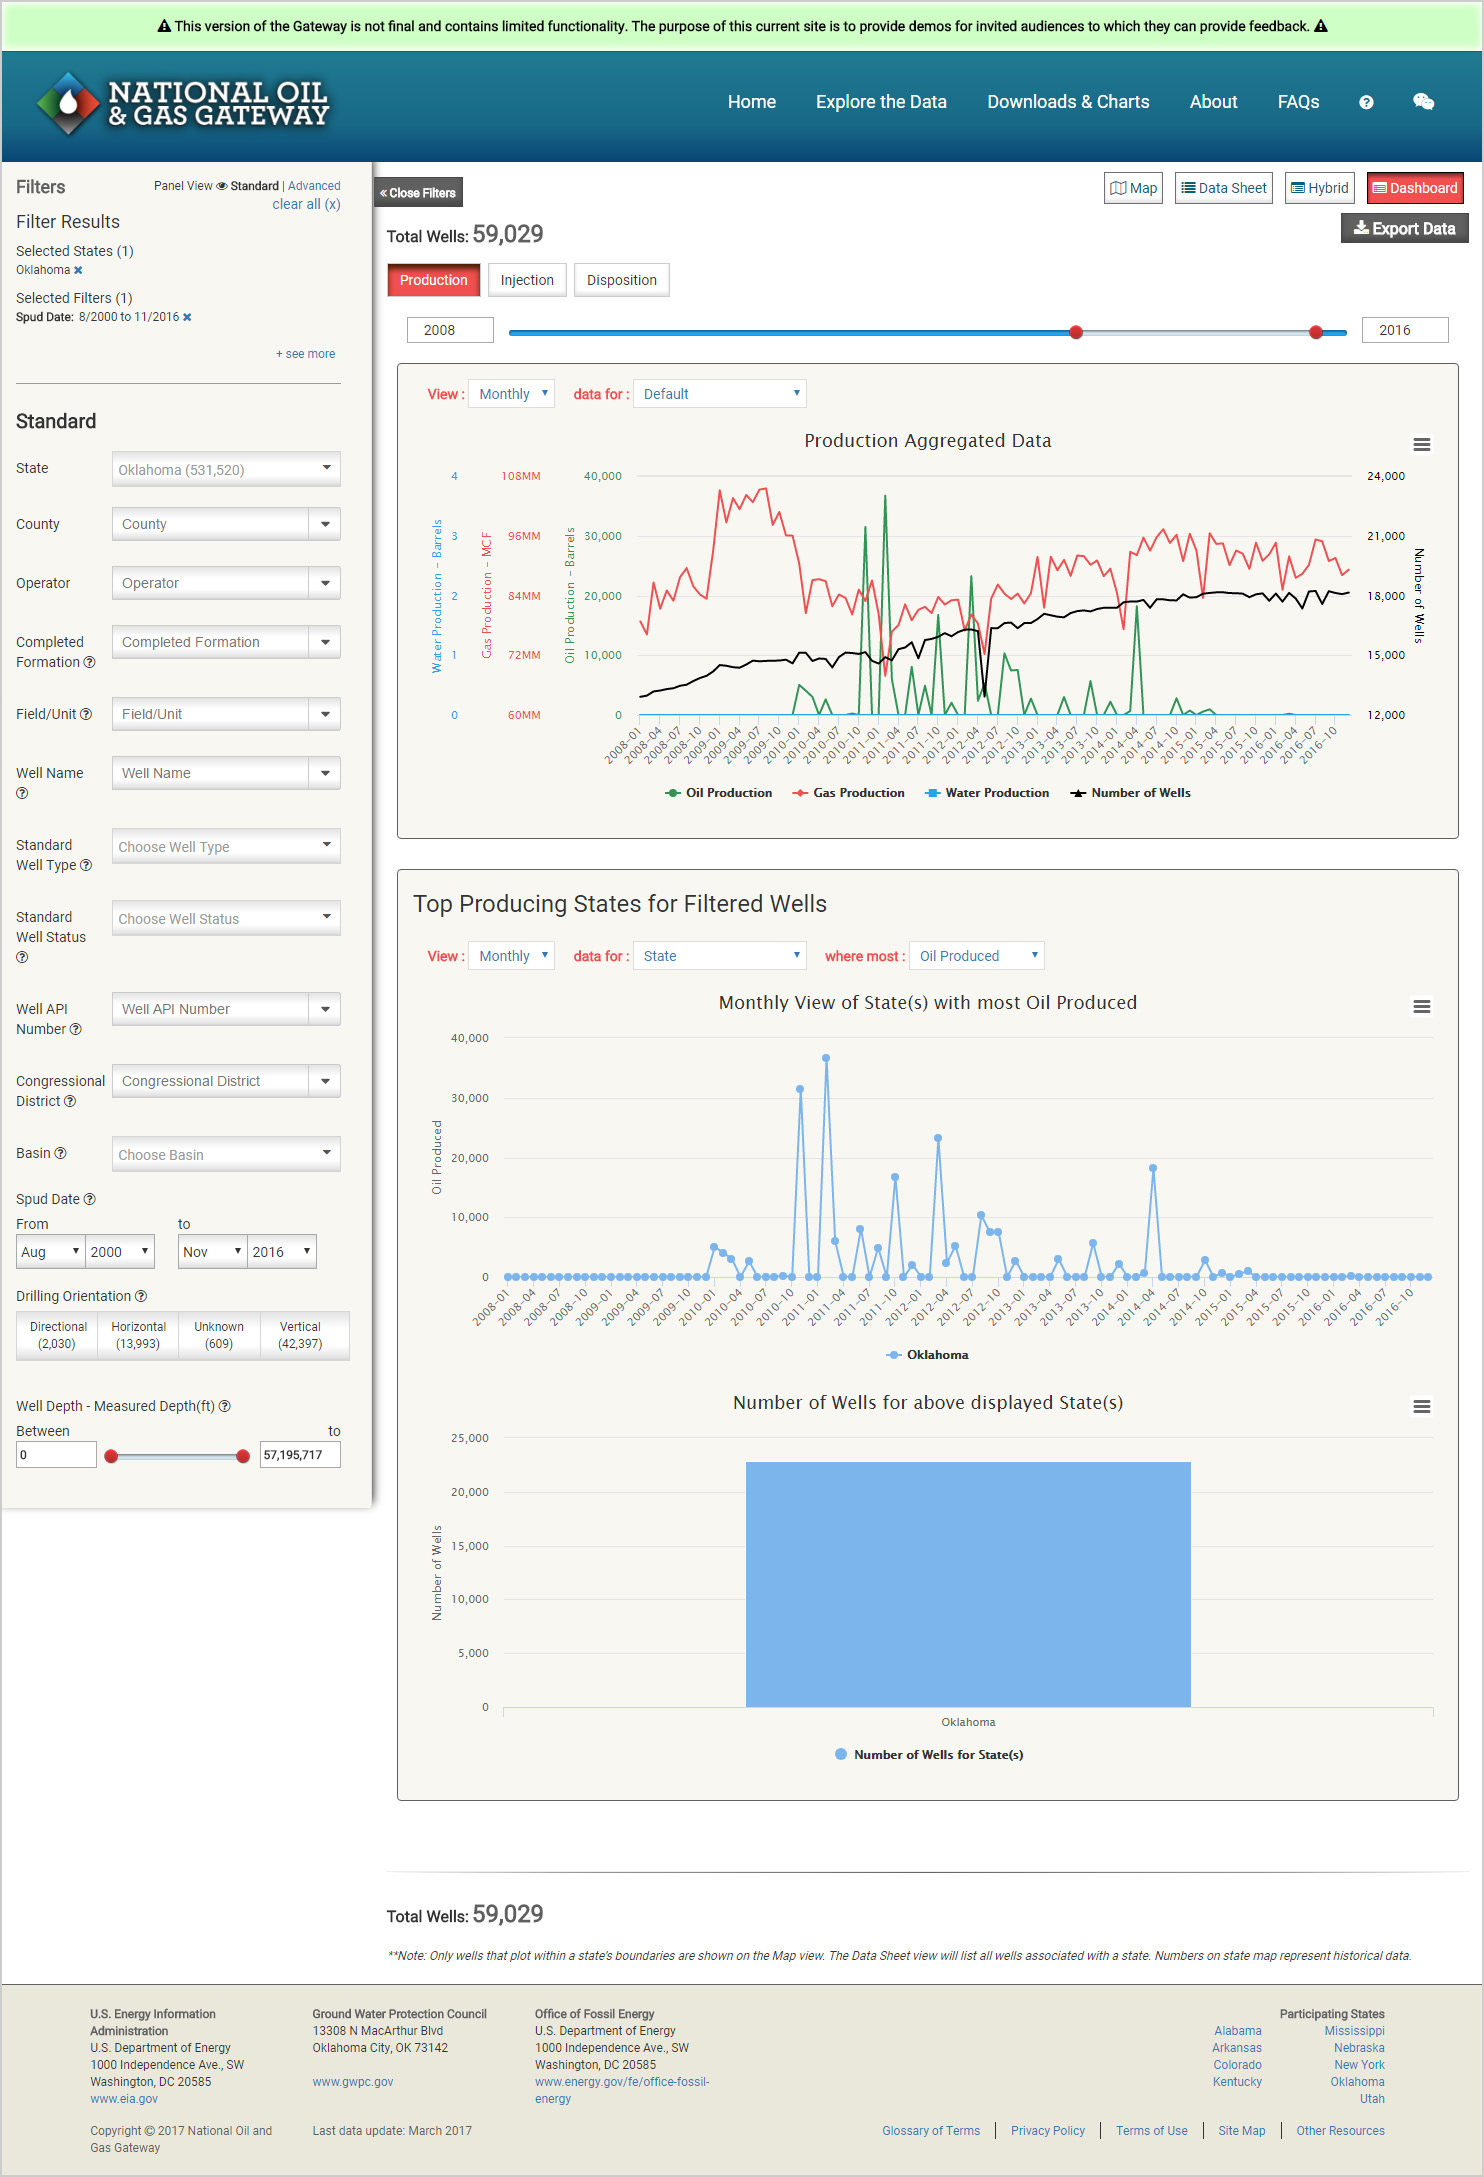
The Dashboard view provides a set of quick visualizations of the currently filtered information. Each section can be individually controlled by pre-generated drop down controls to change the time frame (from Monthly to Annual) and based on specific data points.